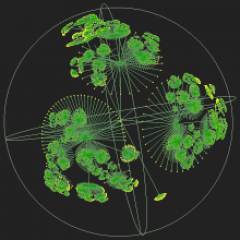
We computed 20 different metrics for software quality evaluation on 68 open source systems of 4 different domains (Application Software, Client-Server Software, Diagram Generator/Data Visualization and Software Development). We detected on these systems 17 code smells and we performed Spearman’s rank correlation between smell frequency and metric values on all 68 open source systems and on each domain.
Tables
Metrics Computed on 68 Open Source Systems >
Smells detected on 68 Open Source Systems >
Spearman’s rank correlation matrix Smell Frequency-Metrics on 68 Open Source Systems >
Spearman’s rank correlation matrix Smell Frequency-Metrics on Application Software domain >
Spearman’s rank correlation matrix Smell Frequency-Metrics on Client-Server Software domain >
Spearman’s rank correlation matrix Smell Frequency-Metrics on Software Development domain >

